 NetflixLATTE 1: distribution of watch time over the week and the year.
Written by: TimDaub and Amir from DATALATTE
Welcome to the RPI Highlight. Here we take a look at the most promising startups in the OceanDAO ecosystem. First up today is DATALATTE, a modern share to earn data union.
For the past month, DATALATTE managed to collect valuable historical Netflix user data by incentivizing users through their first NFT drop "101 data baristas". Today, for the first time, the DATALATTE team is presenting their results: They’ve managed to correlate COVID lockdown with increased Netflix watch time! Read on to find out more.
DATALATTE is a project funded by the OceanDAO. They’ve managed to raise three rounds so far and they’ve been active in the community since September 2021. Their product’s structure currently entails two kinds of actors:
DATALATTE’s mission is to enable all internet users to monetize their digital footprint on an anonymous, secure and fair data marketplace - to receive passive income while retaining sovereignty over their own data. Their vision? A fair data economy that helps users set up passive income.
The current data economy is highly monopolized. The average web2 user gets no monetary benefit or stake in the platform they use. The likes of Facebook, Google and others are taking everyone’s data and selling it for their own profit.
The DATALATTE team, however, believes in a fair data economy where producers are in control of their data and have the free choice to sell it.
They want to challenge the status quo and empower web users so that they can benefit from selling their data, not big tech companies.
DATALATTE aims to implement their vision with a set of values built on three pillars:
Amir (DATALATTE): To welcome our users and include them into our business
model, 101 data baristas
were minted to our early 101 users in return for them uploading their
NetflixViewingHistory.csv. The following information showcases what is
possible with
NetflixLATTE
published in Ocean marketplace.
// NetflixViewingHistory.csv

Movie,Date
Don't look up,2022-01-08
...,...
A table with two columns and a row for each of Netflix’s program views. As a stand-alone data point, it looks useless. That is how most internet users think of their data. But how is big tech cashing in on it?
That's where big data comes in! One data point is perhaps not that useful, but if you pool them together, countless insights come out which can satisfy a multitude of data science branches.
Here is a look into some simple but amusing insights we got:
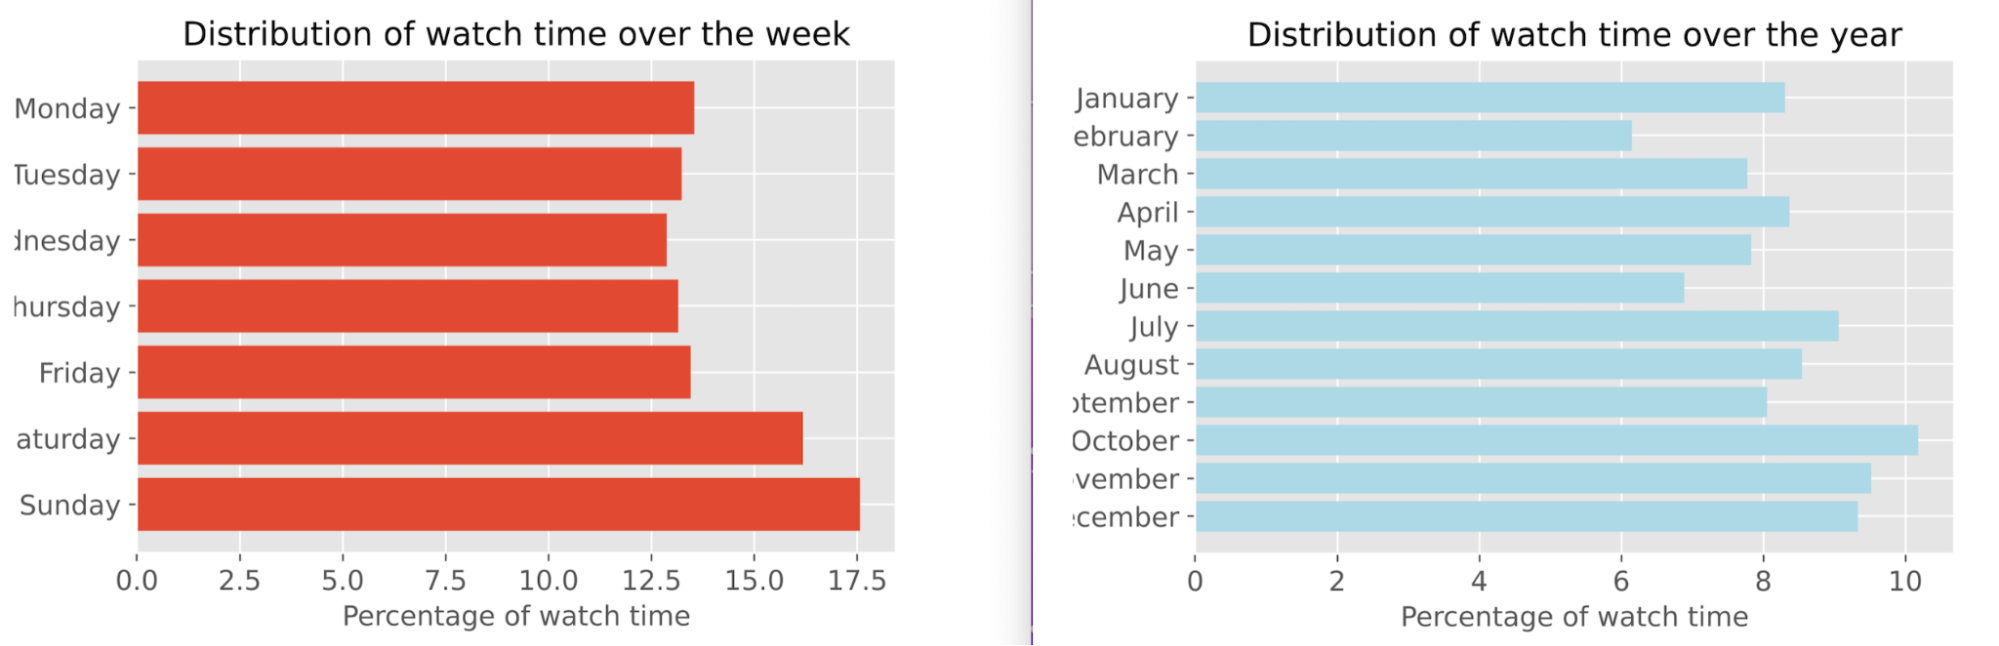
NetflixLATTE 1: distribution of watch time over the week and the year.
It looks like our users prefer to watch more programs at the weekend. Sunday is the most popular day. Are we surprised? No way, who doesn't enjoy a lazy Sunday watching our favorite shows? Looking at the whole year, it looks like most of our users are located in the Northern hemisphere. The long dark nights and Halloween specials might be keeping them glued to Netflix.
It seems that the most popular show was that old classic, Friends. The Most popular movie is 6 Undergrounds featuring Ryon Gosling from back in 2019.
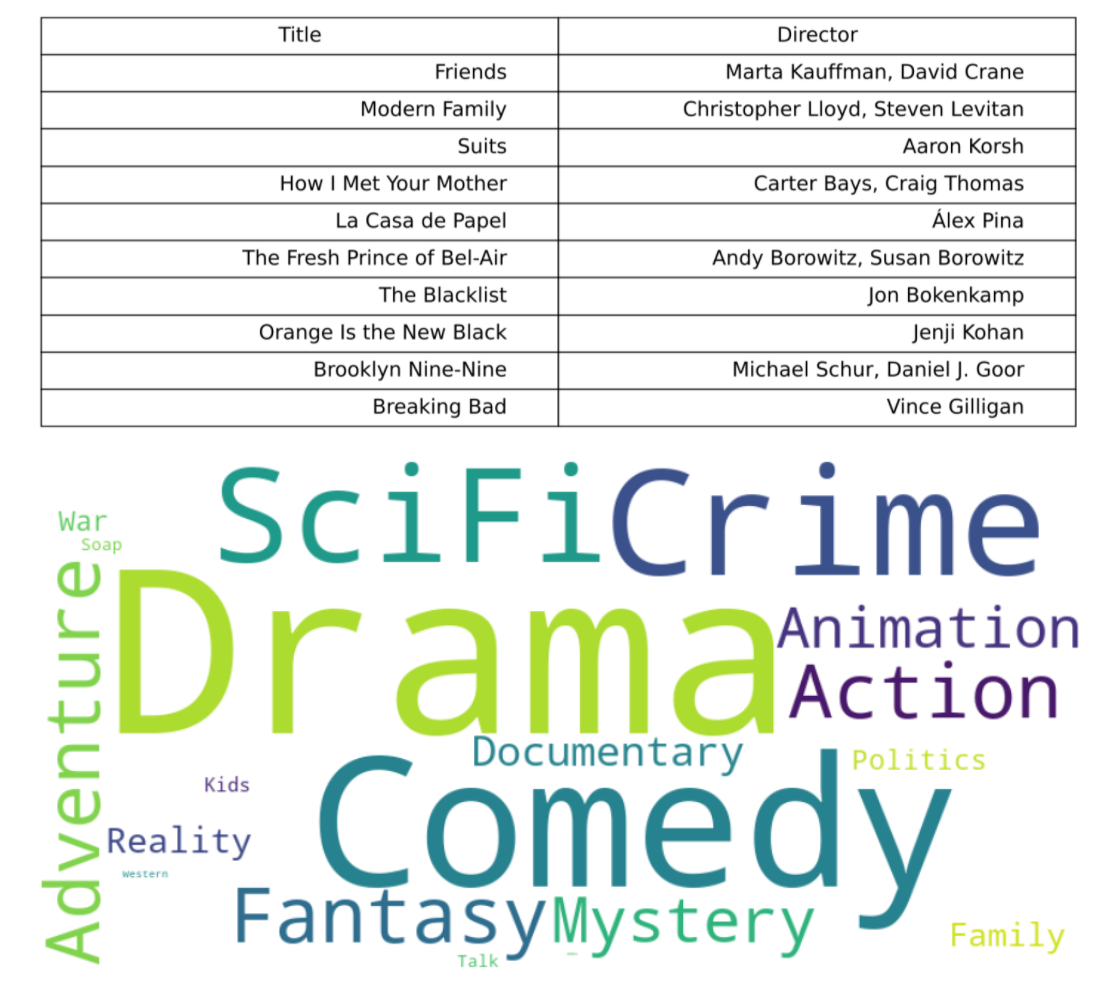 Most popular series and most popular series genres in word cloud.
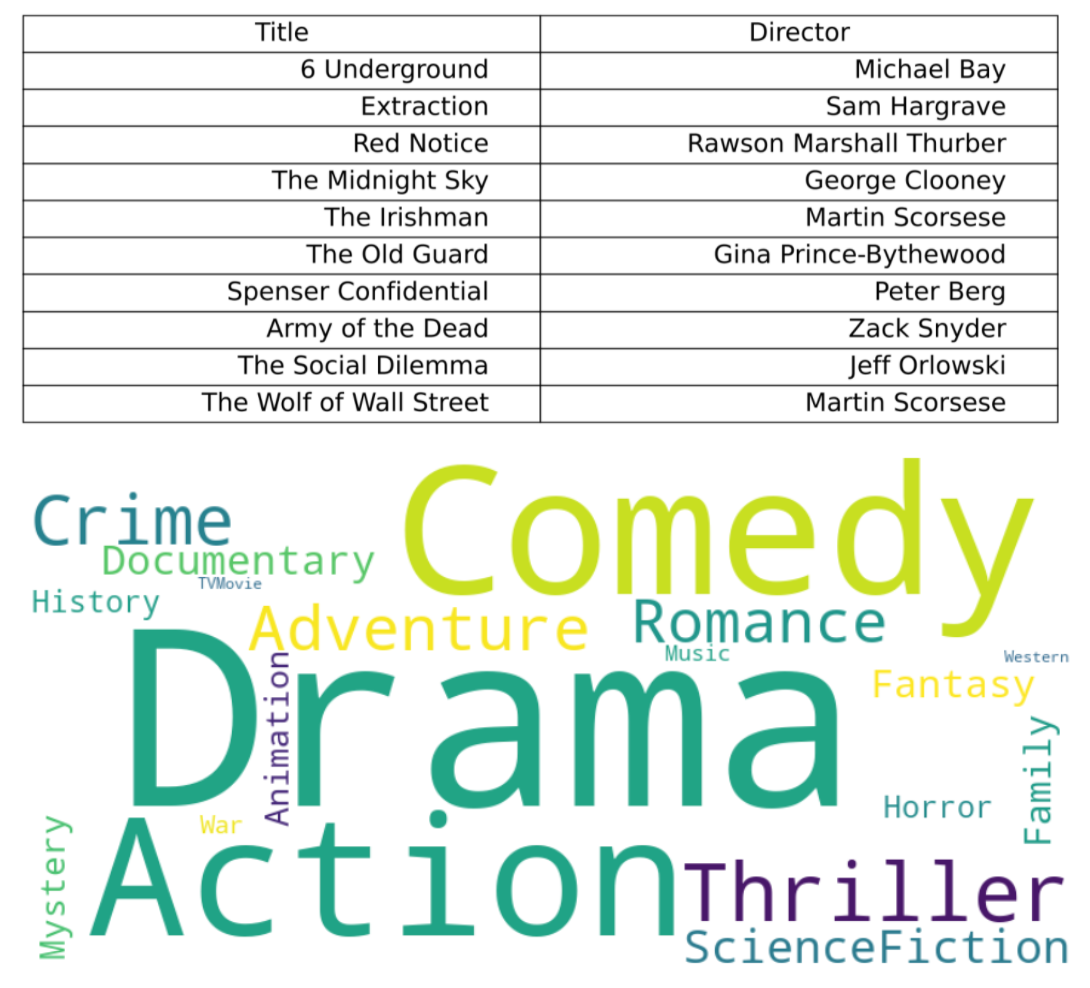 Most popular movies and most popular movie genres in word cloud.
So far, it was amusing to look at the most simple insights. But how about bringing the metadata of each of the programs. Specifying if it is a movie or series, TMDB ID (The movie Database ID), the genre and detailed profile of the cast and the crew, the budget, etc. All this metadata is collected thanks to the free TMDB API which enables our data consumers to collect any metadata with the provided TMDB ID.
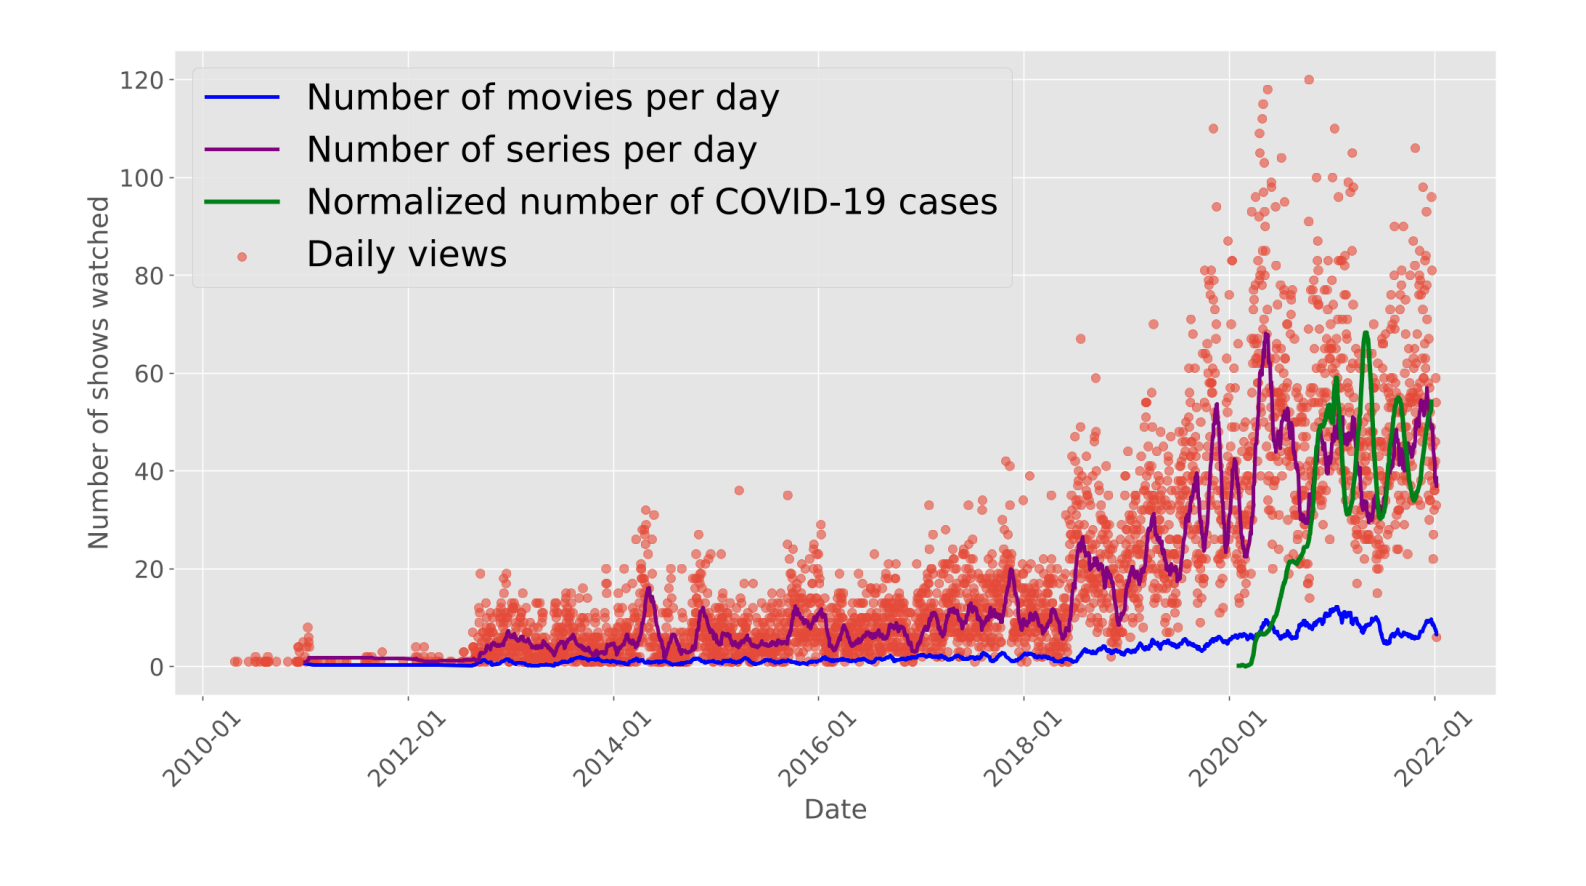
The on-going COVID-19 pandemic made a recognizable impact on many aspects of how we live. It was pretty evident by looking at the moving average of views since the pandemic grew since 2020. We can see a close correlation between users’ views and the COVID-19 cases. Lockdown brought people to Netflix.
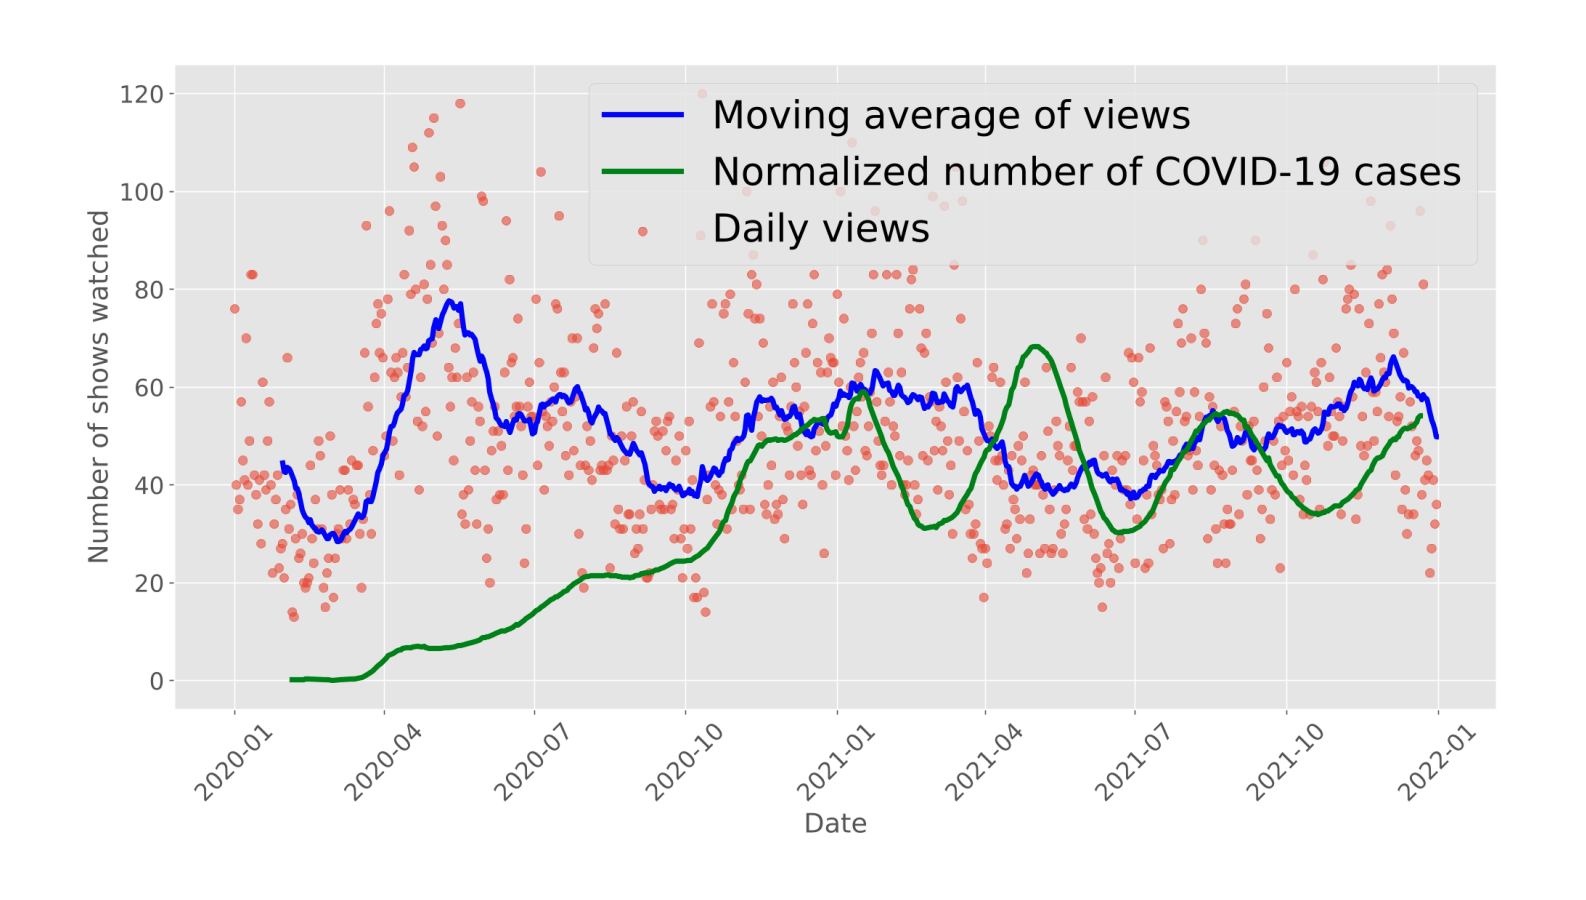
When we have a closer look, we realize that since people know for a foreseeable time, there is a lock down, they have more tendency to start watching a new series than watching movies.
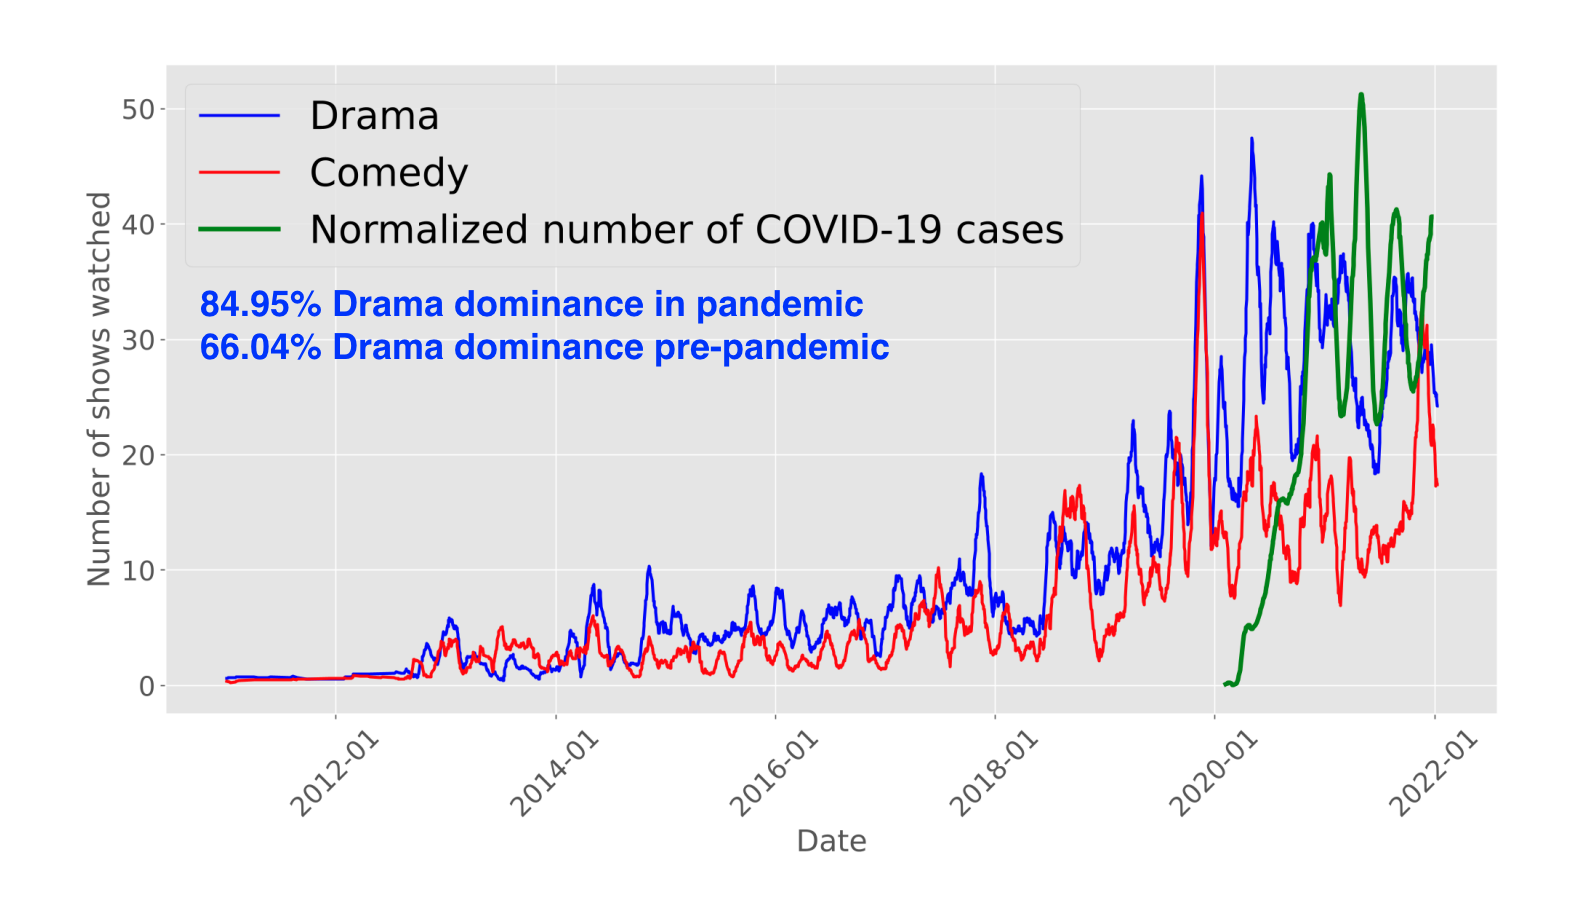
Did the pandemic influence viewing choices? Turns out it did. It turned out that during the pandemic, Drama programs became more popular (by 20%) than pre-pandemic time. It has been a dramatic time after all.
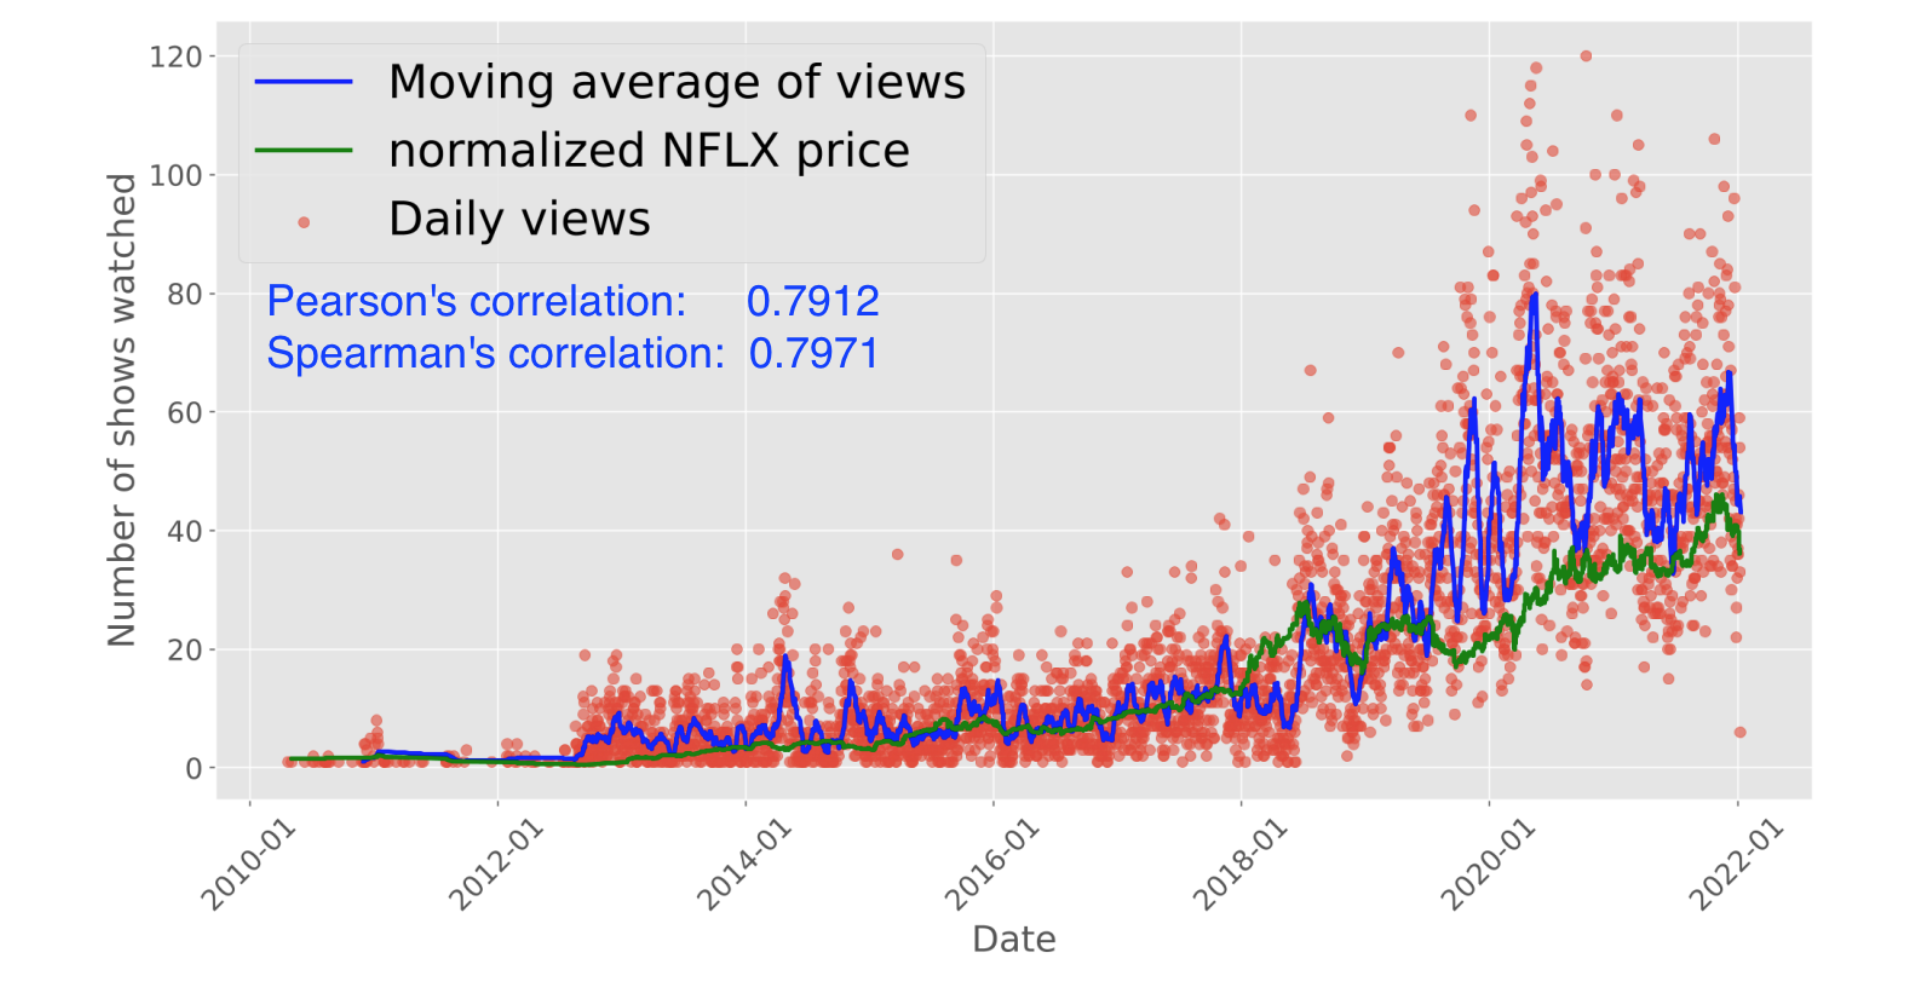
In order to understand the correlation between users’ views and $NFLX price action (Two variables with independencies), we need to measure the linear and monotonic correlation between the two. So, we measured Pearsons and Spearman correlation parameters which shows approx. 80% correlation.
So what initial prices shall we give to NetflixLATTE 900MB of 71k lines of programs with rich metadata? Given our vision to enable a fair data economy, we think the price should be affordable to any data scientist around the world.
This empowers data scientists to create their own independent services and gain a fair share of the data economy, rather than being limited to big tech for their big data!
We believe that a free market can figure out the right price, therefore we published NetflixLATTE at the price of 1 $Ocean on the Polygon network and let the price be discovered by the market mechanism.
Written by: TimDaub and Amir from DATALATTE
Check out datalatte.ai to learn more.