In OceanDAO Round 3, I announced building towards a graph that shows the index's historical performance. But for the last month or so, most of the changelog I published on the blog was about improving database queries. Indeed, I had to adjust all of those to show the following graph today:
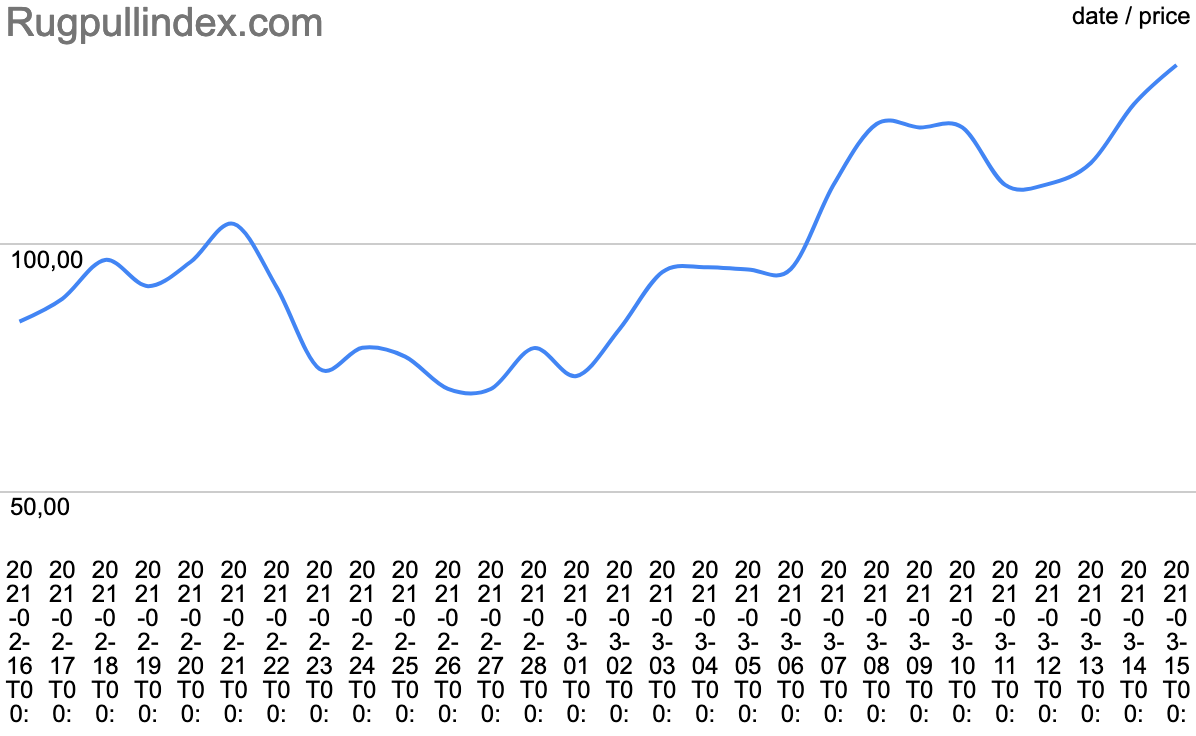
Here, you can see a first try at displaying the index's performance starting on February 15, 2021, to March 15, 2021. X-axis showing the dates of measurement, y-axis the index's price in EUR. Please note that I haven't had time to confirm its correctness yet. However, it looks roughly correct. So how did I create this graph?
target = 100 (in EUR)relative_score = score / SUM(scores)share = relative_score * target / priceshare represents the number of tokens the index holds for a
given data set. After buying a target of 100€ in tokens, all I do is note
down daily all token prices. By summing all token prices per day, I get the
index value per day. And those values, I plotted in this graph.I know, for now, that might sound not very easy. But I've plans to improve this communication. Anyways, that's today's update.
Best, Tim
PS: Another change I made today: